Watching a fast motion visualisation of the 2005 Atlantic hurricane season off the Mexican Gulf from space is a humbling experience. From where God is sitting, one can't help but feel awe for the power of nature.
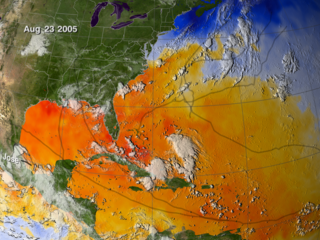
The reconstructed weather maps taken from the Aqua and GOES-12 satellites is combined with temperature mapping of water surface temperatures, with orange depicting 31 degrees Celsius (87 Fahrenheit), the temperature at which the water starts to foment into hurricane fuel.
From January 1, 2005, a week before Arlene to Wilma on 0ctober 19, 2005, the visualisation takes 120 seconds showing the oceans build up heat reservoirs over summer to expel it as a hurricanes, offering some temporary relief to the ocean temperatures before another tropical storm ferments. Watch the seas just to the north of and around Cuba heat up, build up and inevitably become the genesis of Katrina.
It's also fascinating to watch the water bodies dramatically cool down in the wake of a hurricane, as the excess heat energy is transferred into extreme weather. You can get a real sense of this being one of Gaia's homeostatic mechanisms to maintain equilibrium, much like sweating is one of ours.
:::[NASA mpeg]
:::[21 Named Storms From the 2005 Atlantic Hurricane Season]
Other blogs on: global warming climate change hurricane katrina hurricanes


1 comment:
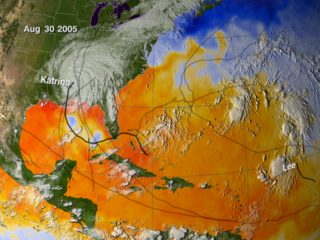
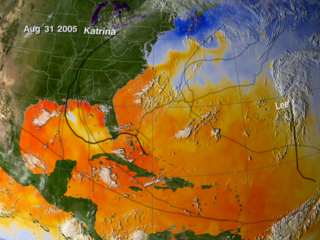
If you'll notice the patch of blue on your 30 and 31 August maps, it was this bubble of cooler water that caused Katrina's winds to drop to below 130 mph at landfall. Unfortunately, the storm surge of up to 30 feet had developed while the storm was still a Cat 5.
The surge caused nearly all of the damage along the Mississippi Coast (Pop. 425,000) New Orlenas suffered a bad case of mis-spent levy funds over the years and the Army Corps of Engineers foul-ups.
Overall, the gulf waters were only slightly above average temperatures for late summer.
Bob
Ridgeland, Ms
Post a Comment